The Vanguard of Technological Evolution
The Magnificent Seven are seven companies at the forefront of technological evolution in the ever-evolving landscape of global commerce. Their exceptional financial acumen solidifies their prominent position in the S&P 500 index and highlights their key role in the investment industry.
Understanding the financial standing of these companies is imperative for making informed investment decisions. Their robust balance sheets, consistent revenue streams, and innovative capabilities offer a comprehensive picture of market resilience and future growth potential, providing valuable insights for investors and educators.
Decoding FY2024: A Deep Dive into Q1 and Q2 Financial Strategies of Tech Titans
Revenue Growth and Technological Impact

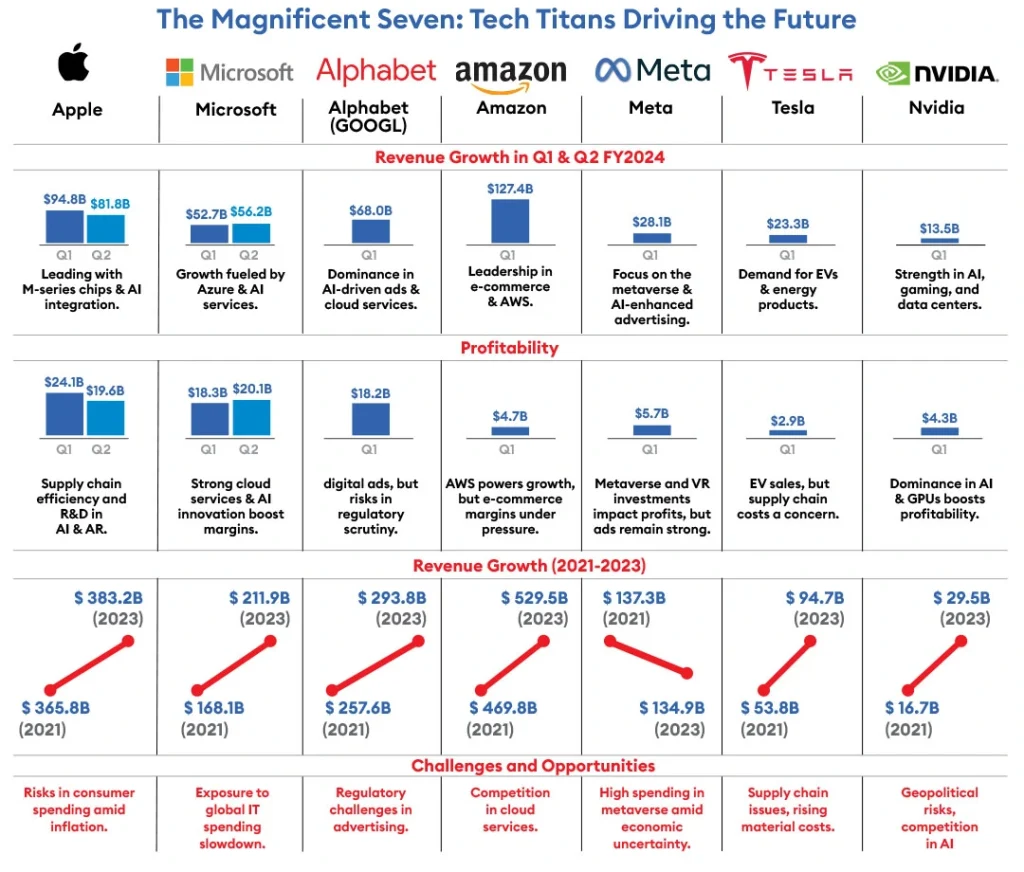
Apple’s Q1 FY2024 revenue reached $94.8 billion, followed by Q2 FY2024 revenue of $81.8 billion, showcasing strong growth fueled by its cutting-edge technological advancements, such as the M-series chips and AI integration throughout its ecosystem. The organization’s commitment to advancing digital services and hardware capabilities has resulted in consistent revenue growth. Apple’s dependence on consumer spending positions it at risk during economic downturns and periods of tightening monetary policies. Rising inflation and the potential for a global recession may influence discretionary spending, which could subsequently affect the demand for Apple’s premium products and services.
Microsoft’s revenue surged from $52.7 billion in Q1 FY2024 to $56.2 billion in Q2 FY2024, fueled mainly by the robust performance of its cloud computing division, Azure, and strategic AI initiatives, including Copilot in Office 365. This growth signifies a pivotal transition in the market, as organizations are progressively embracing cloud services to optimize expenditures and elevate operational efficiency. The sustainability of this growth hinges on the stability of global markets. A deceleration in economic activity, especially within developed markets, may lead to a decrease in enterprise investment in IT services, consequently affecting Microsoft’s cloud and AI divisions.
Alphabet’s Q1 FY2024 revenue reached an impressive $68.0 billion, primarily fueled by its leadership in digital advertising and robust cloud services. The organization’s revenue expansion is driven by its dominance in AI-driven advertising targeting and cloud AI solutions. Nonetheless, Alphabet faces significant exposure to cyclical advertising demand, which may diminish during a global recession. Furthermore, heightened regulatory oversight and possible antitrust measures in the U.S. and EU may impede revenue growth and operational agility.
Amazon’s Q1 FY2024 revenue of $127.4 billion underscores its unwavering leadership in e-commerce and cloud computing (AWS). The company’s further growth is driven by its extensive logistics framework and cutting-edge AI algorithms that streamline operations and elevate customer satisfaction. Amazon is currently navigating a range of challenges in the existing economic landscape. Reduced consumer spending driven by inflationary pressures and a possible economic slowdown may negatively impact its e-commerce segment. Furthermore, AWS remains a key growth driver; however, it is facing heightened competition from Microsoft Azure and Google Cloud, which may exert pressure on margins and market share.
Meta’s Q1 FY2024 revenue is $28.1 billion, indicating steady growth as the company pivots towards innovative business models focused on the metaverse and AI-enhanced advertising. The organization’s significant investments in VR/AR technologies and AI capabilities reflect a strategic shift aimed at diversifying revenue streams beyond conventional social media advertising. The effectiveness of this strategy remains ambiguous, especially in light of the current macroeconomic landscape. Economic fluctuations significantly influence Meta’s primary advertising operations, and any downturn may lead to decreased ad expenditures by companies, subsequently affecting revenue.
Tesla’s Q1 FY2024 revenue reached $23.3 billion, fueled by robust demand for electric vehicles and energy products. The organization is capitalizing on the worldwide transition to sustainable energy, bolstered by governmental initiatives and consumer demand for environmentally friendly technologies. Tesla is currently navigating substantial challenges, including supply chain disruptions, increasing material costs, and the possibility of reduced consumer spending stemming from economic uncertainty. Furthermore, as competition in the EV market escalates, sustaining our market share may present greater challenges.
NVIDIA’s Q1 FY2024 revenue reached $13.5 billion, showcasing robust growth driven by its dominant position in the graphics processing unit (GPU) market, essential for AI, gaming, and data centers. The company has capitalized on the increasing demand for AI and machine learning applications, cloud computing, and the metaverse. NVIDIA’s dependence on a limited number of critical sectors exposes it to potential market fluctuations. For example, a decline in data center investment or shifts in AI adoption trends could affect revenue growth. Furthermore, geopolitical tensions, especially between the U.S. and China, present significant risks to their supply chain and market access.
Profitability Metrics and Strategic Investments

Apple’s net income of $24.1 billion in Q1 FY2024 and $19.6 billion in Q2 FY2024 showcases its robust profitability, driven by efficient manufacturing and supply chain management, complemented by strategic investments in proprietary technologies. Nonetheless, substantial R&D expenditures associated with AI, AR, and other cutting-edge technologies could exert pressure on margins if these investments fail to generate new revenue streams. Furthermore, Apple’s profitability faces risks from currency fluctuations and supply chain challenges, especially due to its dependence on Chinese manufacturing.
Microsoft’s net income of $18.3 billion in Q1 FY2024 and $20.1 billion in Q2 FY2024 underscores strong profitability, fueled by high-margin cloud services and productivity software. The organization’s ongoing commitment to AI and cloud infrastructure strategically positions it for future expansion, while simultaneously heightening its vulnerability to potential economic downturns, during which enterprises might reduce their technology expenditures. As Microsoft continues to broaden its global presence, it is essential to adeptly manage intricate regulatory landscapes that may influence its cost structure and overall profitability.
Alphabet achieved a net income of $18.2 billion in Q1 FY2024, primarily driven by its digital advertising sector. The organization’s profitability is bolstered by high-margin digital ads; however, this also represents a considerable risk. As economic conditions tighten, organizations may scale back their advertising expenditures, which could affect Alphabet’s primary revenue stream. Furthermore, the company’s aggressive investment in cloud services and AI technology is essential for sustainable growth, though it entails risks of margin compression stemming from significant capital expenditures and competitive pressures.
Amazon’s profitability presents a multifaceted picture, highlighted by its Q1 FY2024 operating income of $4.7 billion, largely fueled by AWS. AWS continues to be a significant profit contributor with robust margins; however, the retail segment is experiencing margin challenges stemming from increasing costs such as logistics, wages, and inflation. Investing strategically in AI, logistics automation, and cloud services is essential for Amazon’s growth trajectory. However, the profitability of these areas is vulnerable to shifts in consumer demand and heightened competition in the cloud computing and e-commerce sectors.
Meta’s net income of $5.7 billion in Q1 FY2024 underscores the persistent challenges faced in evolving from a conventional social media advertising framework to innovative revenue avenues such as the metaverse. The company’s profitability faces challenges as we continue to invest heavily in VR/AR technologies and AI, which have not yet delivered substantial returns. Furthermore, Meta is under significant examination and regulatory challenges globally, which may affect its expenses and its capacity to drive revenue from its core advertising operations.
Tesla achieved a remarkable net income of $2.9 billion in Q1 FY2024, driven by robust demand for its vehicles and energy products. Nonetheless, the margins are facing mounting pressure due to escalating raw material costs and logistical hurdles. The organization’s strategic investments in battery technology, autonomous driving, and global manufacturing are critical for sustaining its competitive advantage. However, these initiatives carry significant risks, such as potential regulatory challenges, geopolitical tensions, and economic downturns that may impact consumer demand.
NVIDIA achieved a net income of $4.3 billion in Q1 FY2024, underscoring its dominance in the rapidly expanding GPU market. The organization’s profitability is enhanced by robust demand in AI, gaming, and data center applications. NVIDIA’s profitability depends heavily on the cyclical dynamics of these industries. A decline in demand for data centers, decreased gaming engagement, or a lag in AI adoption could profoundly affect its margins. Furthermore, export restrictions or geopolitical tensions may impact profitability, especially in critical markets such as China.
Balance Sheet Strength and Digital Assets
Apple possesses total assets amounting to $332.4 billion, with liabilities standing at $275.4 billion and equity recorded at $57 billion. While Apple boasts a robust asset base, its elevated liability-to-asset ratio reveals a considerable dependence on debt. In a rising interest rate environment, this may elevate borrowing costs, affecting the ability to invest in new technologies. Apple’s significant digital assets, including its proprietary silicon and software ecosystem, consistently deliver a competitive advantage and strengthen its market resilience.
Microsoft’s balance sheet demonstrates impressive strength, showcasing total assets of $410.1 billion, liabilities amounting to $192.7 billion, and equity standing at $217.4 billion. The low debt-to-equity ratio underscores a commitment towards prudent financial management, ensuring the capacity to pursue strategic investments in cloud infrastructure and AI technologies. Geopolitical risks and regulatory challenges in international markets may influence global operations, necessitating strategic management of the asset base.
Alphabet boasts a robust balance sheet, showcasing total assets of $365.7 billion, liabilities amounting to $104.8 billion, and equity standing at $260.9 billion. The organization’s minimal debt positions us to strategically invest in innovative technologies and potential acquisitions. Nonetheless, the company’s vulnerability to regulatory scrutiny and the possibility of significant fines pose risks to its financial stability. Alphabet’s significant investments in AI and cloud infrastructure are essential for future growth; however, they require careful consideration in light of regulatory and competitive pressures.
Amazon’s balance sheet demonstrates a balanced debt position alongside substantial total assets. The company’s substantial investments in logistics, data centers, and AI-driven technology demonstrate a strategic commitment to sustainable growth; however, these initiatives also introduce potential risks regarding the efficiency of capital allocation. Any notable decline in consumer spending or competitive challenges in the cloud computing sector may require a thorough evaluation of its capital structure and leverage.
Meta’s balance sheet reflects substantial cash reserves, offering a solid foundation to support its bold investments in the metaverse and AI. However, with total liabilities increasing as a result of significant capital expenditures, the organization is confronted with potential liquidity risks should these investments fail to deliver the anticipated returns. Regulatory scrutiny regarding data privacy and monopolistic practices presents potential liabilities that could affect Meta’s financial stability.
Tesla’s balance sheet demonstrates a strategic approach to leverage, emphasizing asset growth, especially in manufacturing and battery technology. Investments in new gigafactories and autonomous technology are crucial for maintaining market leadership; however, they also elevate financial risk. Tesla faces significant risks from supply chain volatility, geopolitical tensions, and changing consumer demand in the EV market, which could impact its financial stability if not strategically addressed.
NVIDIA features a robust balance sheet, underpinned by a substantial asset base that reflects its dominance in the GPU market. Nonetheless, the organization’s vulnerability to export limitations and geopolitical conflicts, especially concerning China, may influence its supply chain and revenue streams. NVIDIA’s significant dependence on critical markets and targeted high-growth sectors exposes it to potential market fluctuations and cyclical declines.
The Financial Journey of Tech Titans: Three Years of Growth and Strategic Shifts
Analyzing these companies’ financial indicators determines their strong financial position and growth patterns. This analysis thoroughly examines their financial performance, focusing on revenue streams, profit margins, balance sheets, and cash flow statements.

Profitability Performance
1. Apple
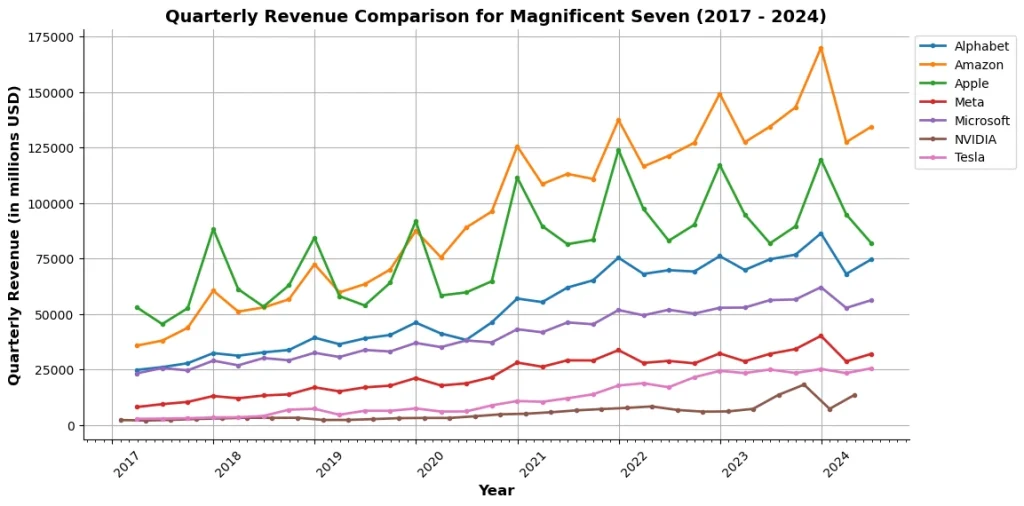
Apple has consistently shown impressive revenue growth, reaching $365.8 billion in 2021, $394.1 billion in 2022, and slightly lower at $383.2 billion in 2023.
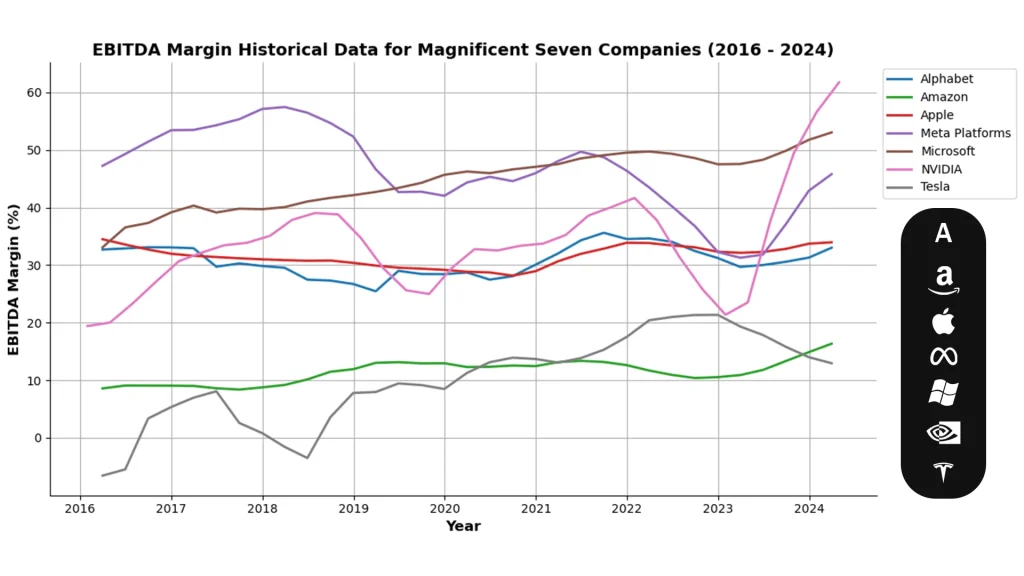
Despite experiencing a decline in 2023 attributed to market saturation and heightened competition, Apple maintains impressive profit margins, consistently exceeding 32% in EBITDA (Earnings Before Interest, Taxes, Depreciation, and Amortization) margins.
This demonstrates effective cost management and impressive profitability, fueled by the success of high-margin products such as the iPhone and various services and its robust ecosystem.
2. Microsoft
Microsoft has demonstrated remarkable revenue growth, increasing from $168.1 billion in 2021 to $211.9 billion in 2023. Microsoft’s EBITDA margins, approximately 42%, demonstrate the company’s successful transition to cloud computing with Azure.
This shift has resulted in higher margins compared to its traditional software business. The steady growth in revenue and impressive profit margins indicate a strong and adaptable business model. Microsoft’s revenue growth is driven by its cloud computing services, with Azure playing a significant role.
The steady revenue growth from 2021 to 2023 showcases Microsoft’s impressive performance in this industry, compensating for any decreases in traditional software sales.
3. Amazon
Amazon dominates the market in revenue generation, raking in an impressive $469.8 billion in 2021, and is shown to soar to $529.5 billion by 2023.
Nevertheless, the company’s profit margins are pretty narrow, experiencing fluctuations in EBITDA margins ranging from 9.8% to 12.3%.
The low margins underscore the difficulties in the retail sector, where fierce competition and substantial operational costs continue to be a concern. Amazon’s expansion in AWS, its cloud computing division, is critical to driving future profitability due to its higher margins. Amazon continues to experience strong growth, fueled by its dominant position in e-commerce and the expansion of its cloud computing services through AWS. The company has seen substantial expansion in its entertainment and subscription services. The modest slowdown in 2023 can be attributed to the saturation of the e-commerce market and the heightened regulatory scrutiny.
4. Google (Alphabet)
Alphabet has witnessed consistent revenue growth, increasing from $257.6 billion in 2021 to $293.8 billion in 2023. EBITDA margins, which have improved to 43.3%, highlight its prominence in the online advertising industry and its growing cloud services.
The impressive margins demonstrate the company’s ability to scale and generate profits through its advertising model, backed by a large user base and data-driven insights. Alphabet’s consistent revenue growth can be attributed to its substantial presence in online advertising with Google and its diversification into cloud services and other technologies, even in the face of growing competition from platforms such as Amazon and Meta.
5. Facebook (Meta)
Meta saw some fluctuations in revenue, experiencing a minor decline in 2022 before bouncing back to $134.9 billion in 2023. The decline in profit margins from 39.7% in 2021 to 28.9% in 2023 can be attributed to heightened regulatory scrutiny and intensified competition. Despite these challenges, Facebook continues to generate significant profits by capitalizing on its large ( About 3 bn MAU) user base and advertising platform.
Meta encountered difficulties with its primary advertising business but demonstrated resilience by diversifying its efforts, such as investing in the metaverse. The increase in revenue in 2023 demonstrates the positive outcomes of these new ventures, even in the face of a highly competitive social media environment.
6. Tesla
Tesla’s revenue growth is impressive, increasing from $53.8 billion in 2021 to $94.7 billion in 2023. The company’s EBITDA margins have improved significantly, to 27.6%, showcasing its optimized operational efficiencies and manufacturing scale. Tesla’s phenomenal rise can be attributed to its effective increase in vehicle deliveries and expansion into the energy solutions market.
However, the company needs to overcome some obstacles, such as supply chain issues and competition from other players in the industry. Tesla’s revenue growth is driven by the growing popularity of electric vehicles and its energy solutions. Despite facing challenges in the supply chain and competition from other automakers, Tesla’s market share continues to grow, showcasing the high demand for its groundbreaking products.
7. Nvidia
Nvidia’s revenue grew substantially, soaring from $16.7 billion in 2021 to an impressive $29.5 billion in 2023.
The impressive EBITDA margin of 41.4% underscores the profitability of its GPUs and data center products, which are critical in powering gaming, AI, and data centers. Nvidia’s strong presence in AI and gaming has consistently propelled its financial performance, solidifying its position as a major player in these rapidly expanding markets.
Balance Sheets and Cash Flow
1. Apple
Apple’s balance sheet is strong, with assets of $351.0 billion and liabilities of $287.0 billion as of 2023. The shareholders’ equity is $64.0 billion, indicating strong financial health. Operating activities generate a substantial cash flow of $104.0 billion, while financing activities, primarily due to stock buybacks and dividends, are committed to returning capital to shareholders.
2. Microsoft
Microsoft’s 2023 balance sheet shows a strong equity position, with total assets of $411.9 billion and liabilities of $191.8 billion.
The company’s shareholders’ equity is $220.1 billion, and its cash flow from operating activities is $89.0 billion, reflecting significant investments in growth areas and substantial shareholder returns through dividends and buybacks.
3. Amazon
Amazon has a substantial asset base, with $420.5 billion in assets and $278.1 billion in liabilities. Its shareholders’ equity is $142.4 billion, but its thin profit margins require close monitoring. Amazon’s cash flow from operating activities is robust at $66.0 billion, but high capital expenditures cause significant negative cash flow from investing and financing activities.
4. Google
Google’s balance sheet is healthy, with assets of $365.4 billion and liabilities of $108.9 billion. Shareholders’ equity is $256.5 billion, indicating financial stability. Operating cash flow of $91.0 billion is strong, with substantial investments in future growth and significant capital returns to shareholders.
5. Facebook
With assets of $165.0 billion and liabilities of $41.5 billion, Facebook has a healthy operating cash flow of $39.0 billion despite regulatory challenges. The company’s negative cash flow from investing and financing activities is due to ongoing technology and infrastructure investments and shareholder returns.
6. Tesla
Tesla’s total assets are $83.8 billion and liabilities are $42.2 billion, with a balanced financial position. The company’s $14.5 billion cash flow from operating activities reflects strong core operations, while its negative cash flow from investing and financing activities is due to debt repayments and stock buybacks.
7. Nvidia
With $46.0 billion in assets and $19.5 billion in liabilities, Nvidia has $26.5 billion in shareholders’ equity. Its operating cash flow is $9.0 billion, indicating efficient core operations. Negative cash flow from investing and financing activities reflects shareholder returns.

The Magnificent Seven companies are leading the pack in technological evolution and innovation, showcasing remarkable resilience in their financial performance despite varying economic conditions. Each company showcases distinct advantages in its primary sectors, capitalizing on innovations in AI, cloud computing, digital advertising, e-commerce, and sustainable technologies to sustain growth paths. While these strengths are notable, each company encounters unique challenges, including regulatory scrutiny, market saturation, competitive pressures, and economic downturns, which could influence its future profitability and market standing.
Graph Citations:
Yahoo Finance
- Alphabet Inc. Stock Market Growth: Retrieved from Yahoo Finance. For statistical analysis and visualization, usage is subject to Yahoo Finance Terms of Use.
- NVIDIA Corporation (NVDA) Stock Market Growth: Retrieved from Yahoo Finance. For statistical analysis and visualization, usage is subject to Yahoo Finance Terms of Use.
- Apple Inc. (AAPL) Stock Market Growth: Retrieved from Yahoo Finance. For statistical analysis and visualization, usage is subject to Yahoo Finance Terms of Use.
- Amazon Stock Market Growth: Retrieved from Yahoo Finance. For statistical analysis and visualization, usage is subject to Yahoo Finance Terms of Use.
- Meta Stock Market Growth: Retrieved from Yahoo Finance. For statistical analysis and visualization, usage is subject to Yahoo Finance Terms of Use.
- Microsoft Stock Market Growth: Retrieved from Yahoo Finance. For statistical analysis and visualization, usage is subject to Yahoo Finance Terms of Use.
- Tesla Stock Market Growth: For statistical analysis and visualization, usage is subject to Yahoo Finance Terms of Use.
Macrotrends
- Alphabet Inc. Revenue: Retrieved from Macrotrends. For statistical analysis and visualization, usage is subject to Macrotrends Terms of Use.
- NVIDIA Corporation (NVDA) Revenue: Retrieved from Macrotrends. For statistical analysis and visualization, usage is subject to Macrotrends Terms of Use.
- Apple Inc. (AAPL) Revenue: Retrieved from Macrotrends. For statistical analysis and visualization, usage is subject to Macrotrends Terms of Use.
- Amazon Revenue: Retrieved from Macrotrends. For statistical analysis and visualization, usage is subject to Macrotrends Terms of Use.
- Meta Revenue: Retrieved from Macrotrends. For statistical analysis and visualization, usage is subject to Macrotrends Terms of Use.
- Microsoft Revenue: Retrieved from Macrotrends. For statistical analysis and visualization, usage is subject to Macrotrends Terms of Use.
- Tesla Revenue: Retrieved from Macrotrends. For statistical analysis and visualization, usage is subject to Macrotrends Terms of Use.


